
Woman in front of a real estate graphic about Alpharetta and Milton, Georgia.

The "Unfreezing" of the North Atlanta Market

While national news cycles alternate between talk of a "crash" and a "correction," the data for North Fulton and South Forsyth tells a story of incredible resilience. As we enter Q1 2026, we are witnessing a "Housing Reset"—a shift toward a more balanced, predictable market where both buyers and sellers can finally plan with confidence.


Why 2026 is Different (The Data)

The National Association of Realtors (NAR) predicts an 11% to 14% surge in sales volume this year. Locally, we saw this momentum begin in December 2025:


  •  Alpharetta saw a 19.81% increase in homes sold compared to the previous year.


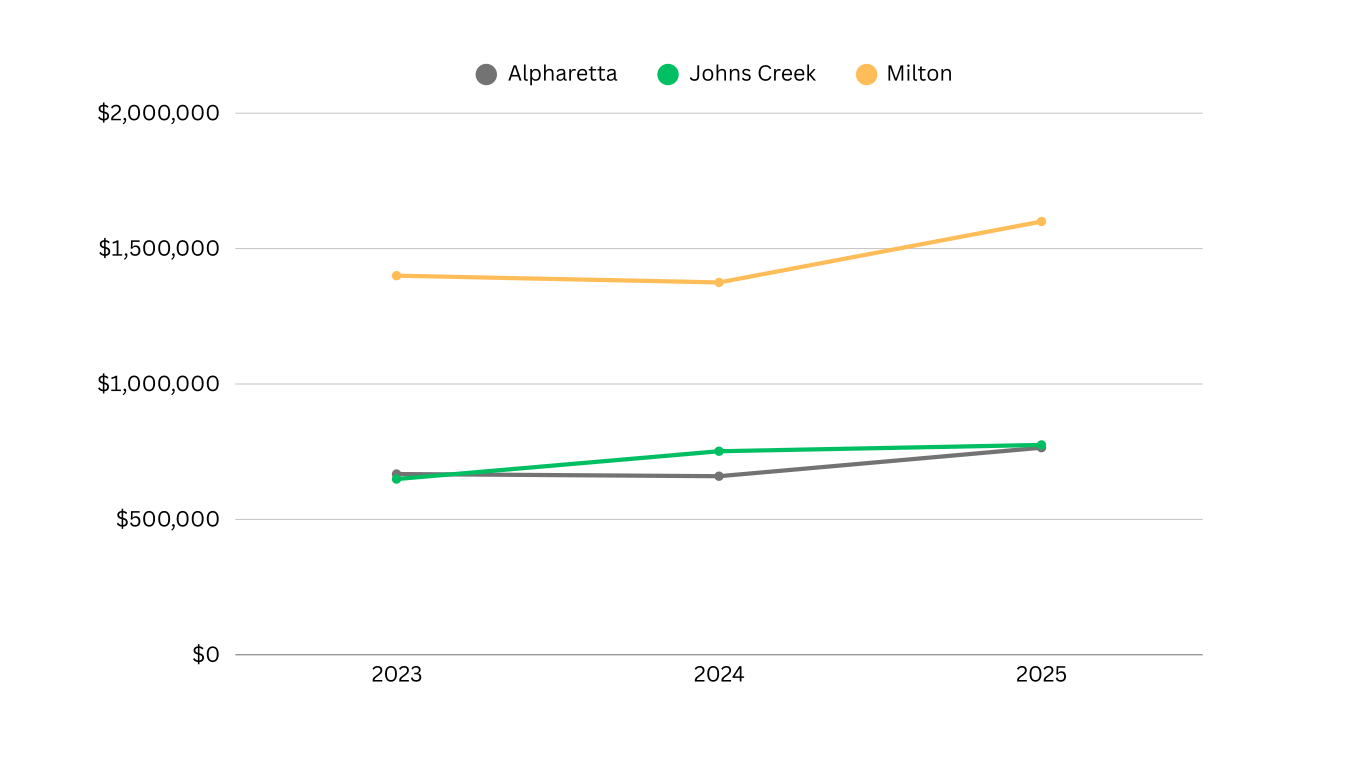
  • Milton median prices hit $1,607,500, a record-shattering 16.91% jump.


  • Johns Creek remains a primary pillar of stability, with median prices reaching $775,000, a steady 3.1% increase that signals long-term equity security.

December Median Sales Price Comparison (2023–2025)
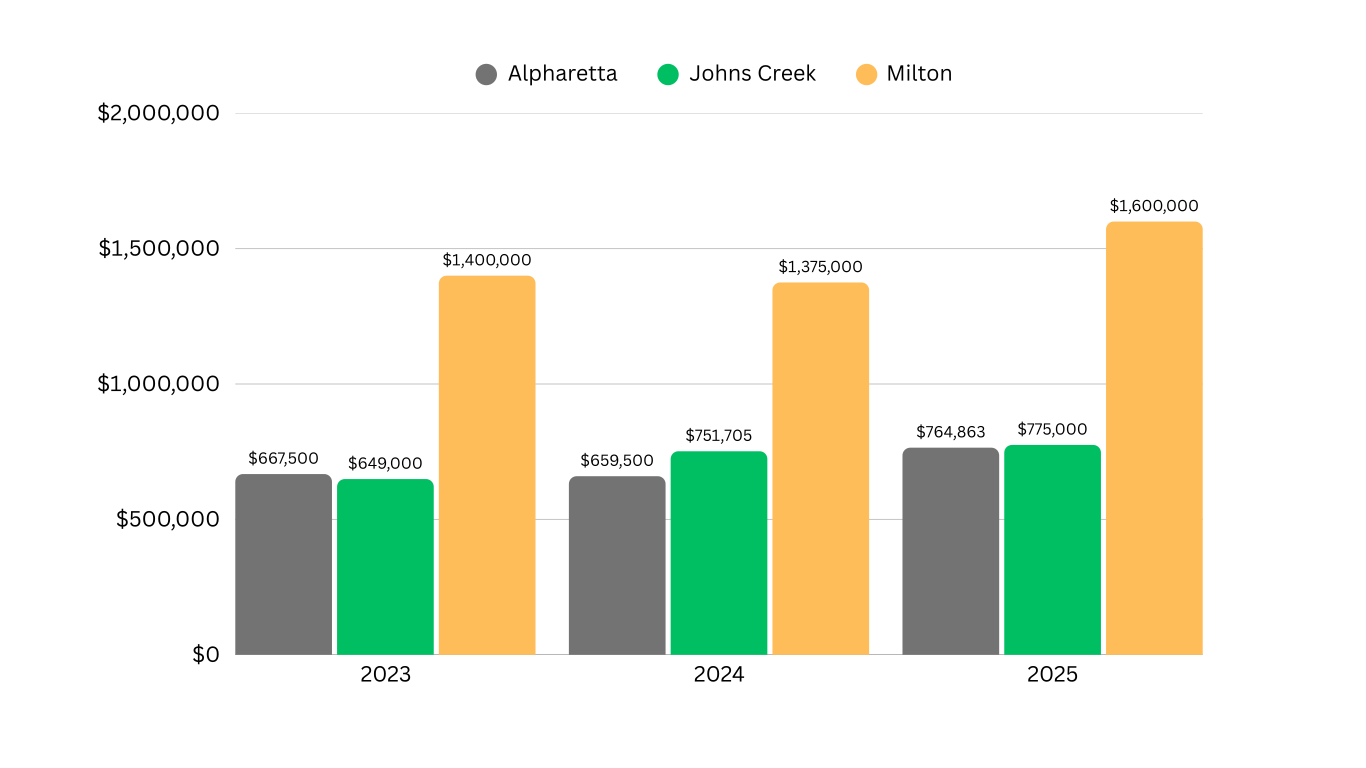
Bar graph comparing sales for Alpharetta, Johns Creek, and Milton over three years: 2022, 2023, and 2024.
Line graph showing revenue of Alpharetta, Johns Creek, and Milton from 2021-2023. Milton's revenue is highest.

Pricing in Alpharetta, Milton, and Johns Creek continues to outperform national trends.

The 6.15% Green Light

For three years, the "lock-in effect" kept sellers from moving. With mortgage rates predicted to stabilize around 6% to 6.3% in 2026, the psychological barrier has broken. Buyers who sat on the sidelines are returning, but they are more data-driven and deliberate than before, treating their home purchase as the high-stakes financial investment it is.For three years, the "lock-in effect" kept sellers from moving. With mortgage rates predicted to stabilize around 6% to 6.3% in 2026, the psychological barrier has broken. Buyers who sat on the sidelines are returning, but they are more data-driven and deliberate than before, treating their home purchase as the high-stakes financial investment it is.
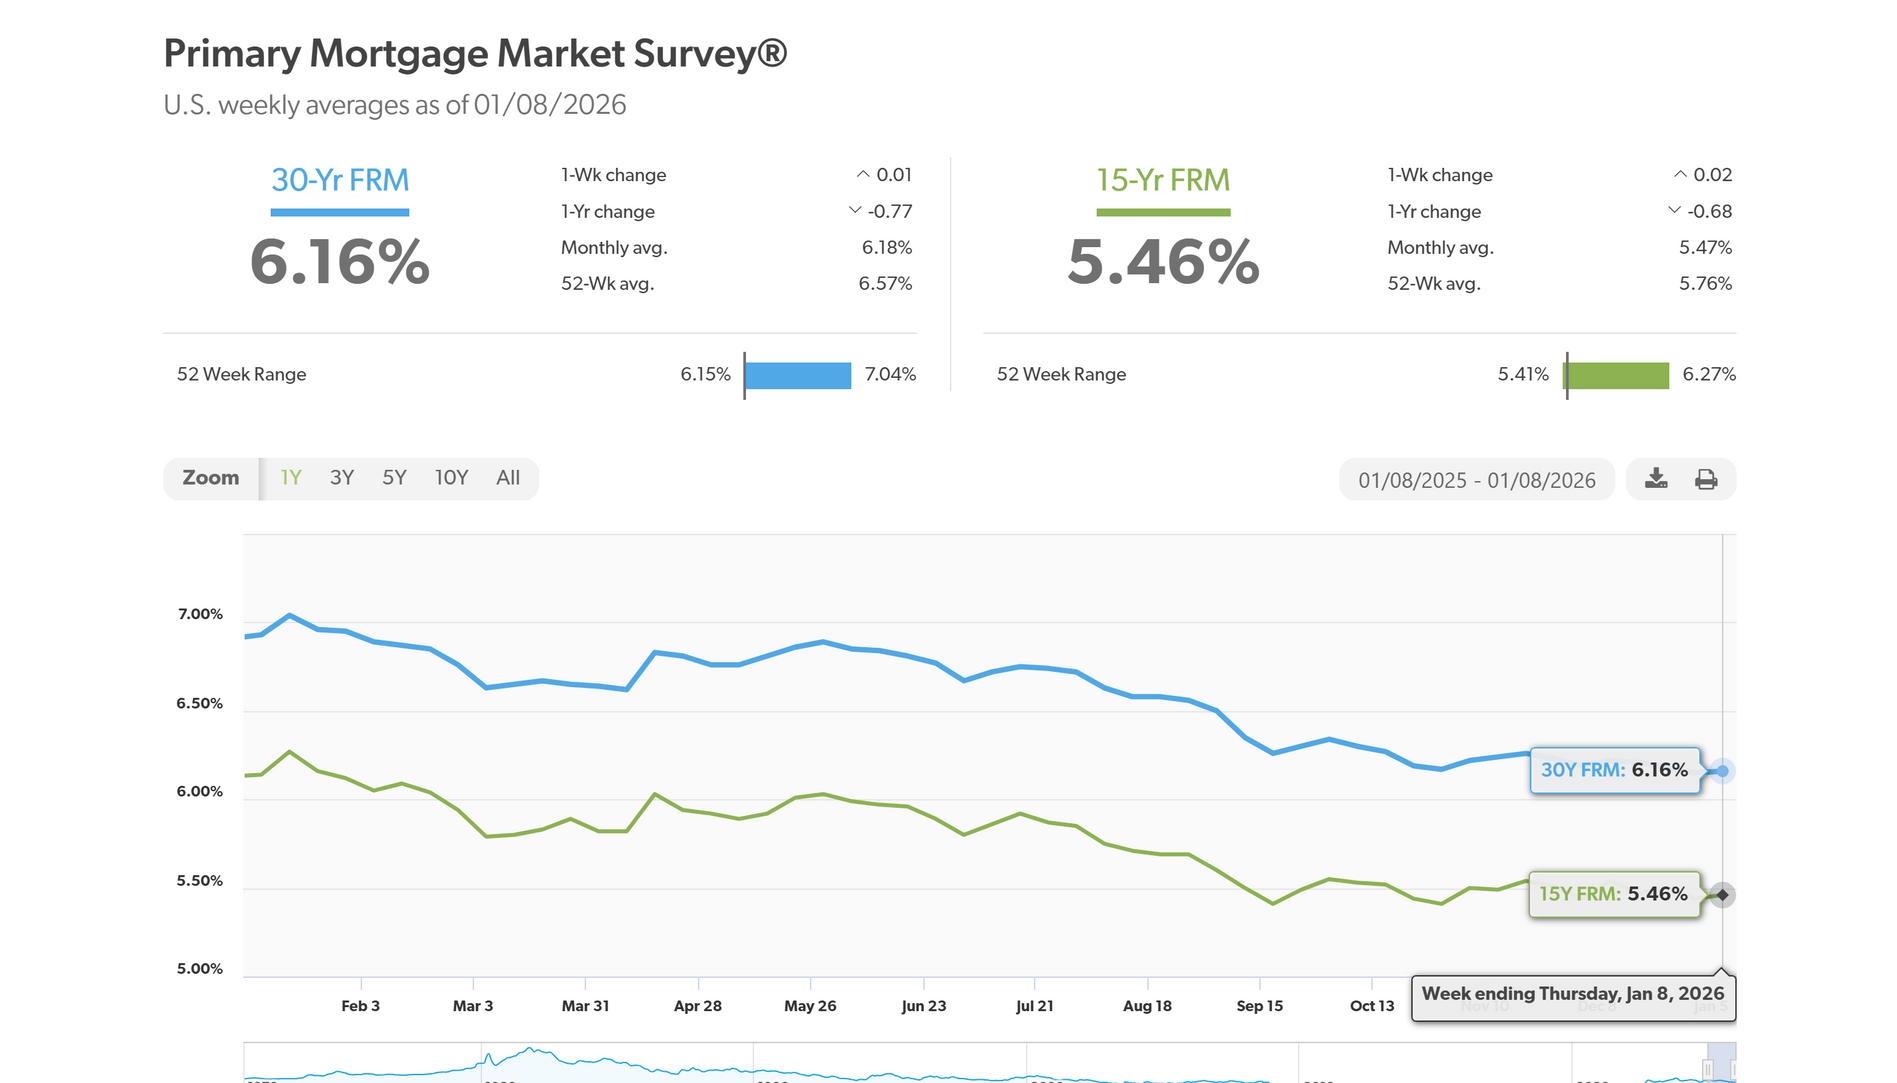
Primary Mortgage Market Survey with interest rate trends in blue (30-year) and green (15-year).

Mortgage rates are stabilizing, improving buyer confidence.

The Hard Truth: Inventory is Not a "Crash"

You may hear that inventory is "exploding"—and while it is rising—contextual data is key. In Alpharetta, inventory is up 43.10%, but our "Months of Supply" remains well below the 6 months required for a true "balanced" market. We aren't seeing a crash; we are seeing a return to choice for the consumer. Conversely, high-demand pockets like Sandy Springs saw inventory drop by 43.28%, proving that the market is hyper-local.
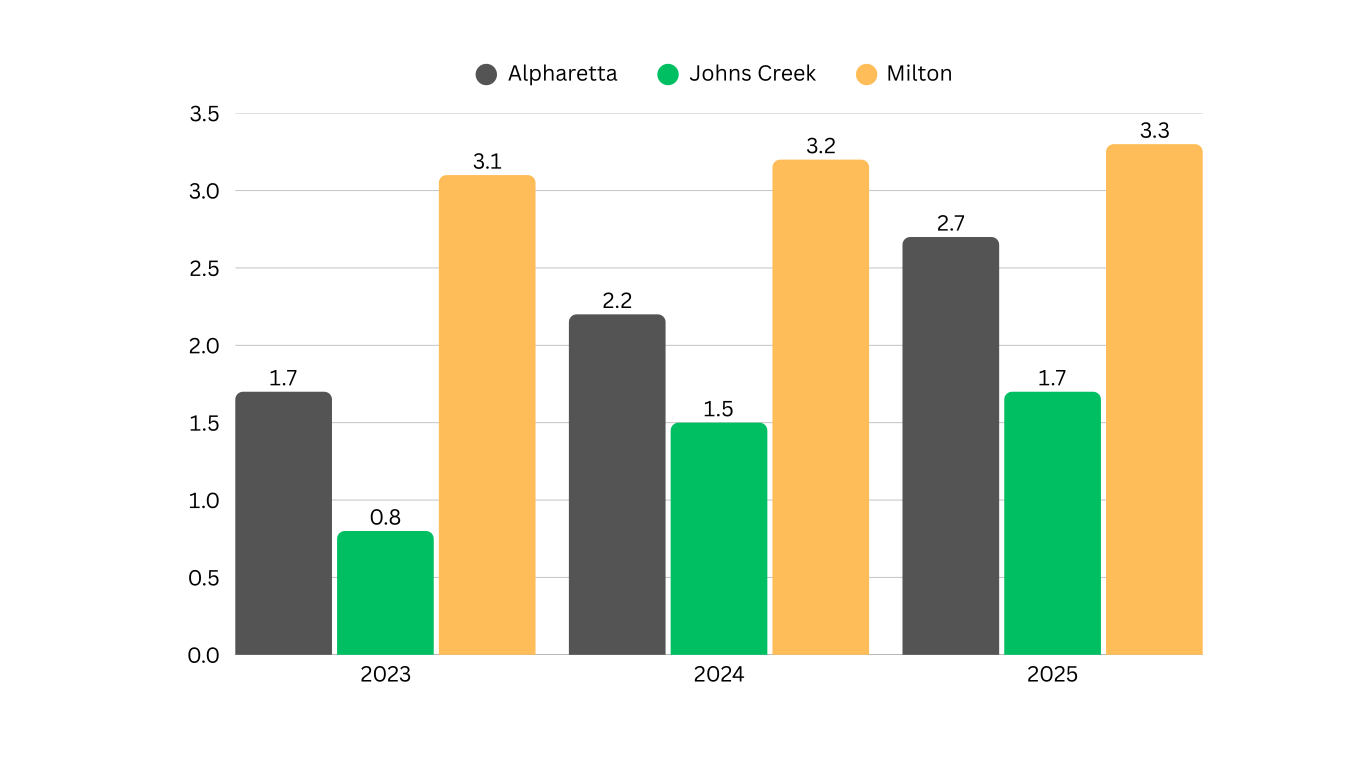
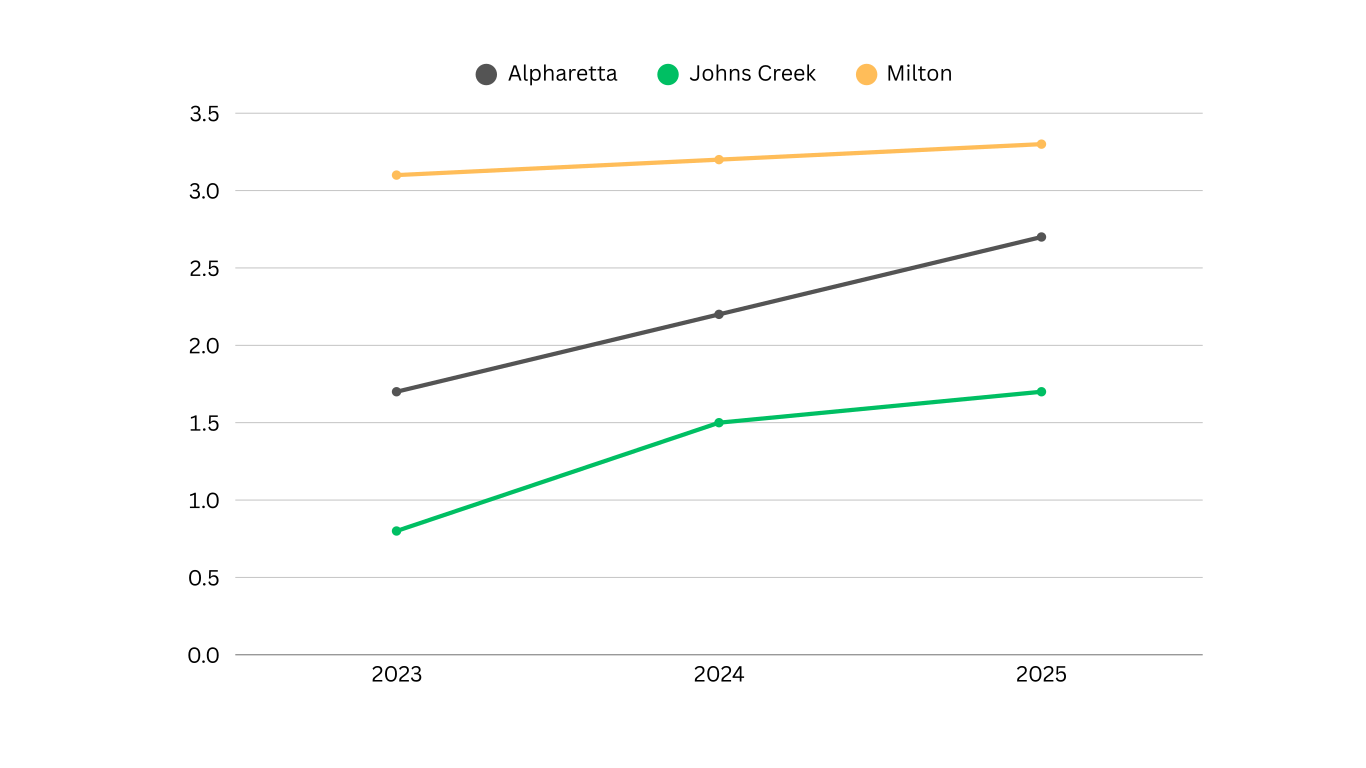
Bar graph showing values for Alpharetta (gray), Johns Creek (green), and Milton (orange) from 2023-2025.
Line graph showing trend data for Alpharetta (black), Johns Creek (green), and Milton (yellow) from 2021 to 2025.

Despite rising listings, most North Atlanta markets remain undersupplied.

Get the 2026 North Atlanta Market Report


The North Atlanta housing market is showing strength and balance in 2026 — especially in Alpharetta, Milton, and Johns Creek — even as national headlines talk about corrections. This exclusive Q1 2026 Market Report and Neighborhood Value Map give you local data, trend insights, and opportunity areas that most buyers and sellers never see.


Click below to access the full report and value map.

Access the 2026 Market Report & Value Map

 The 2026 Neighborhood Value Map

This visual report complements the Q1 2026 Market Report with a neighborhood-by-neighborhood snapshot of performance across North Atlanta — highlighting equity growth zones, stabilized luxury segments, and buyer opportunity areas.

Download the Value Map

Watch: 2026 North Atlanta Housing Market Forecast

For a deeper breakdown of the trends shaping the North Atlanta housing market in 2026, watch the video below. This forecast expands on pricing, inventory shifts, and mortgage-rate stabilization—and explains what these changes mean for your home equity and next move in Alpharetta, Milton, Johns Creek, and surrounding communities.


Real estate ad with house, smiling woman, and text: “THE HIGHEST OFFER ISN’T ALWAYS THE BEST OFFER”
By Jaypee Aligway • October 3, 2026
Selling your home in North Atlanta? Learn why the highest offer is not always the best offer and how to compare net, appraisal risk, financing, due diligence, and closing terms.
Milton vs Woodstock vs Canton: more prestige or more land? Real estate comparison with homes and agent
By Jaypee Aligway • October 3, 2026
Comparing Milton, Woodstock, and Canton? Learn how these North Atlanta areas differ in price, land, lifestyle, commute, luxury, and long-term resale before you choose.
North Atlanta real estate promo with agent and text: “The First 14 Days on Market”
By Jaypee Aligway • September 25, 2026
The first 14 days on market give North Atlanta sellers important feedback from active buyers. Learn why price, condition, presentation, and positioning matter before your listing goes live.
Real estate ad for North Atlanta with house, staircase, and text “You Want to Downsize, But Where Would You Go?”
By Jaypee Aligway • September 17, 2026
Thinking about downsizing in North Atlanta? Learn how to decide whether to downsize, right-size, stay put, sell first, buy first, rent first, and plan your next chapter before listing.
North Atlanta real estate collage with homes, roads, skyline, and agent portrait; text: “What Makes a North Atlanta Home HARD TO APPRAISE?”
By Jaypee Aligway • September 10, 2026
Some North Atlanta homes are harder to appraise because they are harder to compare. Finished basements, pools, acreage, custom features, condition differences, school boundaries, and limited sold comps can all affect value.
Cumming vs Suwanee vs Sugar Hill housing ad with bold text and a woman on the right, plus home interiors and neighborhood views
By Jaypee Aligway • August 31, 2026
Comparing Cumming, Suwanee, and Sugar Hill? Learn how price, commute, county, schools, lifestyle, home age, and resale affect where your money goes further north of Atlanta.
Collage for “Fulton vs Forsyth vs Gwinnett vs Cherokee: The County Line Mistake” with homes, roads, and a woman in a blazer
By Jaypee Aligway • August 26, 2026
Buying in North Atlanta? Learn why county lines matter when comparing Fulton, Forsyth, Gwinnett, and Cherokee homes, including taxes, schools, commute, lifestyle, and resale.
Graphic about researching school feeder patterns before buying in North Atlanta, with map pins and a woman on the right
By Jaypee Aligway • August 17, 2026
Buying in North Atlanta with school priorities? Learn why buyers should verify the exact feeder pattern, school assignment, transportation logistics, and resale impact before choosing a home.
House and realtor with text: “The ‘We’ll Just Test the Market’ Mistake”
By Jaypee Aligway • August 7, 2026
Thinking about testing the market with a higher list price? Learn why North Atlanta sellers need a launch strategy before listing.
Woodstock vs Canton vs Marietta real estate comparison graphic with smiling woman and home interior photos
By Jaypee Aligway • July 27, 2026
Compare Woodstock, Canton, and Marietta before moving north of Atlanta. Learn the lifestyle, commute, home style, and value differences between these popular Atlanta suburbs.
More Posts